Dashboards
Use Dashboards to get an overview of your modeling and test execution activities, as well as to analyze test cases in Eggplant DAI. Dashboards help you determine the status of your test project. For example, whether your test cases have all been hit, percentage of passed vs failed test cases, and so on. There are two types of dashboards in Eggplant DAI:
- Dashboard provides a graphical overview of the various aspects of testing a model.
- QA Summary lets you view a snapshot of your test results for a particular period.
Launching the Dashboard
To get started, simply go to Dashboards > Dashboard, and from the list on the top menu, select the model that you're interested in.
Dashboard
The following widgets make up the Dashboard:
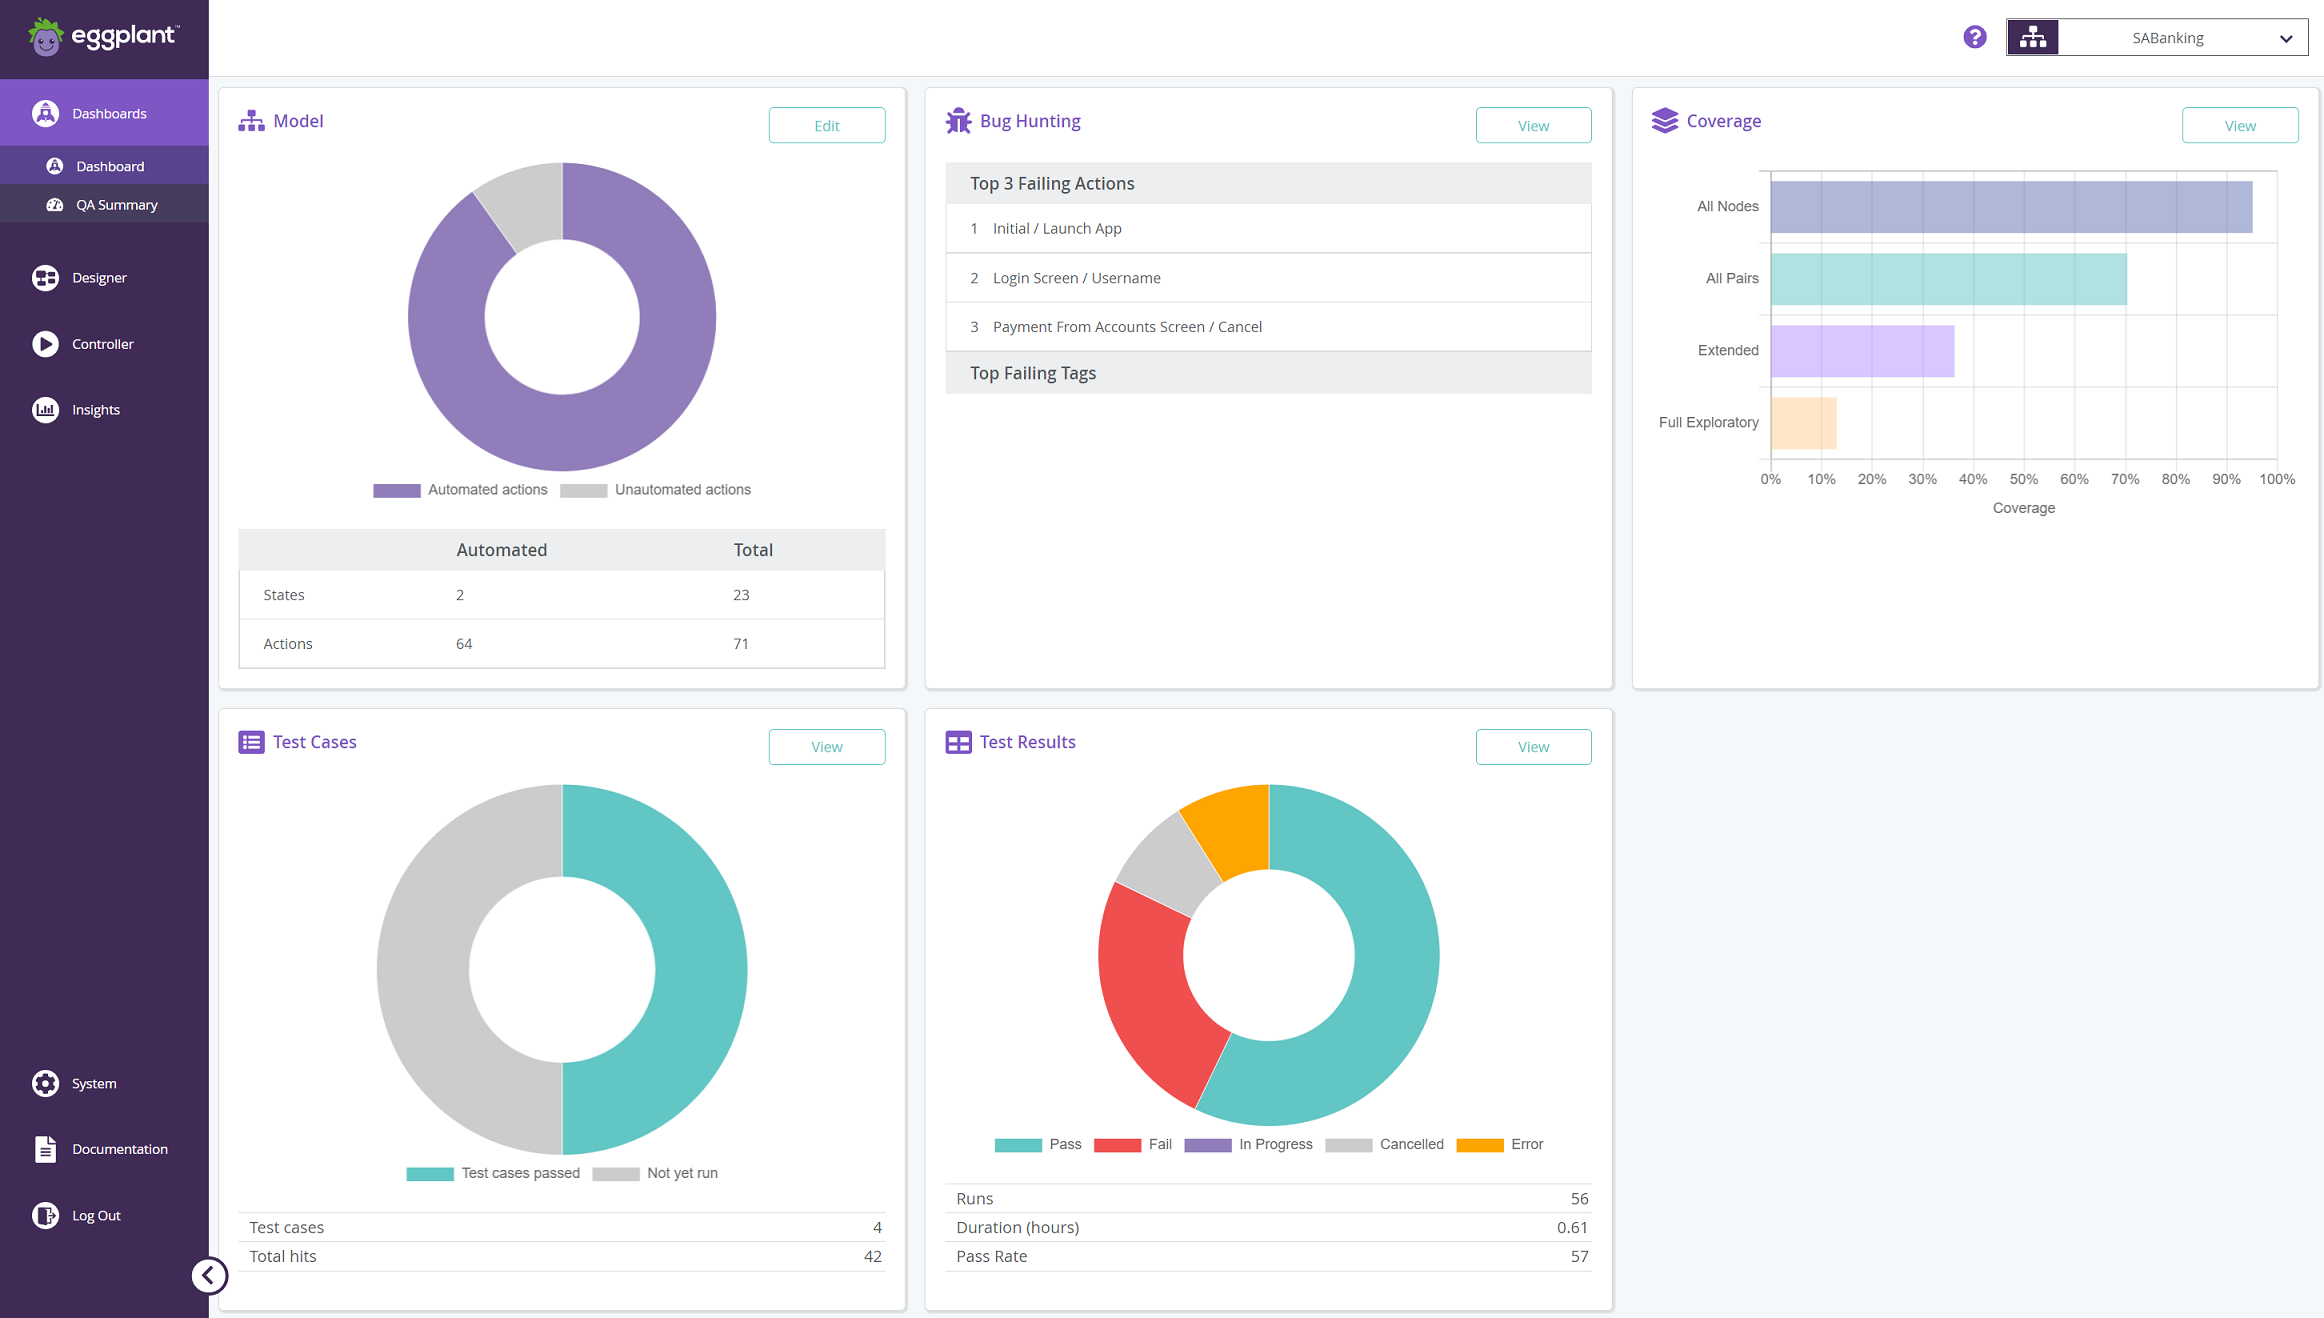
All widgets appear blank until you've executed a model at least once except for:
- Bug Hunting: To display data, at least one of the actions or an associated tag in your model must fail.
- Coverage: To display data, click Load Coverage Chart. To avoid performance issues, coverage metrics are only loaded when you want to view them.
- Test Cases: To display data, you must define and execute at least one test case either via model execution or run as a Directed Test Case
Model
The Model donut chart and table provide an overview of the number of states and actions present in the selected model.
Automated states and actions are those elements that have snippets attached. Use this information to determine how much more work is required to fully connect the model to Eggplant Functional.
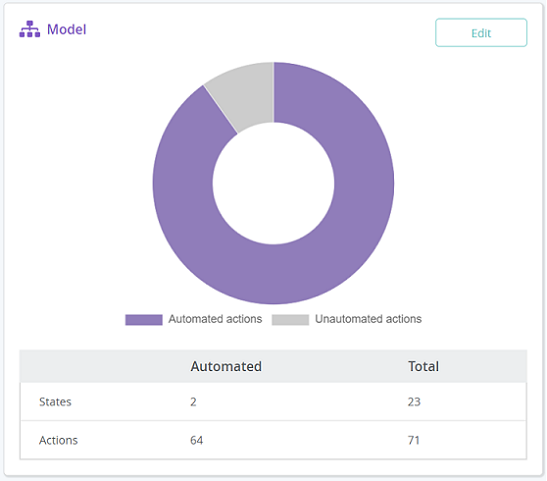
Click Edit to return to the Model workspace to update your model. See Working with Models for more information on using models in Eggplant DAI.
Bug Hunting
The Bug hunting summary table displays the top three failed actions and tags that caused the selected model to fail.
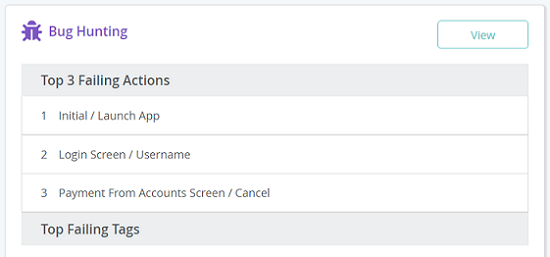
Click View to switch to the full Bug Hunting report in Insights. To learn more about how tags can be useful during debugging, see Using Tags .
Failure data is only available if either an action or an associated tag in your model failed during a test run.
Coverage
The Coverage bar chart compares the test coverage for the default coverage types so that you can see if you're meeting your test coverage targets.
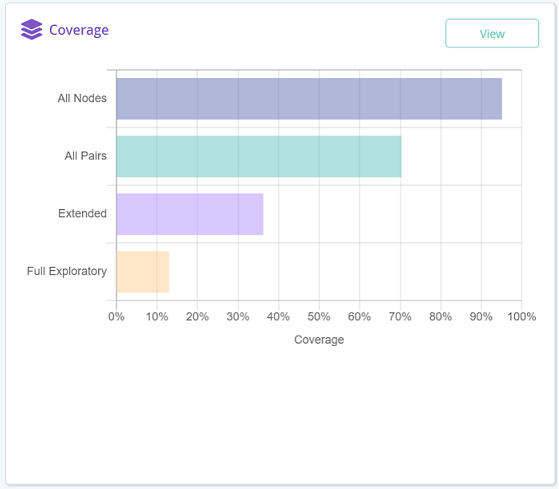
- Click Load Coverage Chart to view the bar chart.
- Click View to switch to the full Coverage report.
Test Cases
The Test Cases donut chart and table provide an overview of the total number of passed test cases versus the test cases that have not been run for the selected model.
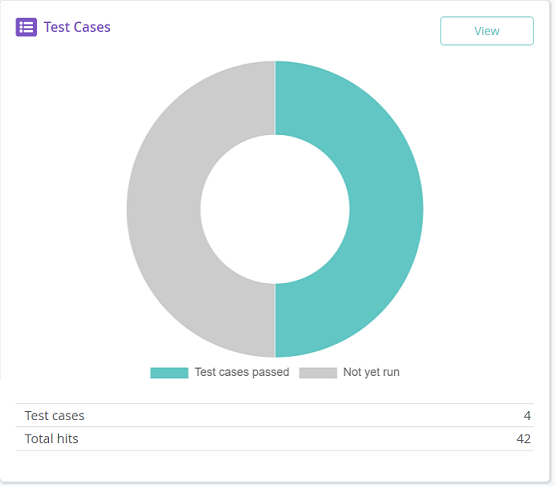
Use the following information to help you to understand any gaps in your testing.
-
Test cases passed: The number of test cases that passed out of the total number of test executions.
-
Not yet run: The number of test cases that have not been run yet.
-
Test cases: The total number of test cases available in the model.
-
Total hits: The number of times the test cases were hit during the model execution. Test case hits are represented by test ID numbers for every instance of a model run where the test case steps were matched.
Click View to switch to the full list of test cases for the selected model.
If you are upgrading from a version prior to DAI 6.1, the chart will not include test cases from these older versions of DAI.
Test Results
The Test Results donut chart and table provide a breakdown of the results of test runs for the selected model.
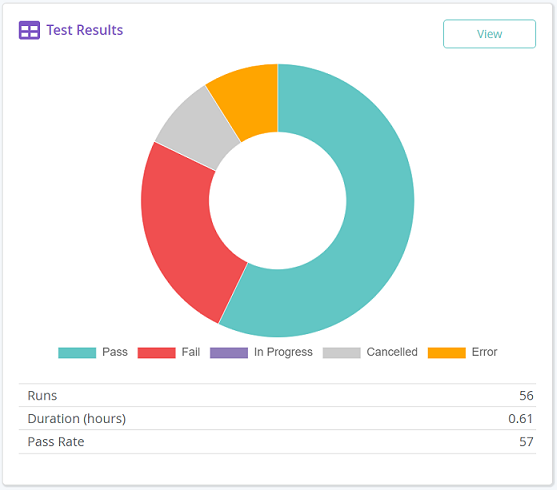
Use the following information to assess whether your model tests are running correctly:
-
Pass: The total number of passed test runs.
-
Fail: The total number of failed test runs.
-
In Progress: The total number of incomplete test runs.
-
Cancelled: The total number of cancelled test runs.
-
Error: The total number of runs with errors.
-
Runs: The number of test runs for all versions of the model from the database, including cancelled runs.
-
Duration: The total time taken for the test runs to complete.
-
Pass rate: The overall percentage of test runs that passed.
Click View to switch to a full list of test results for the selected model.
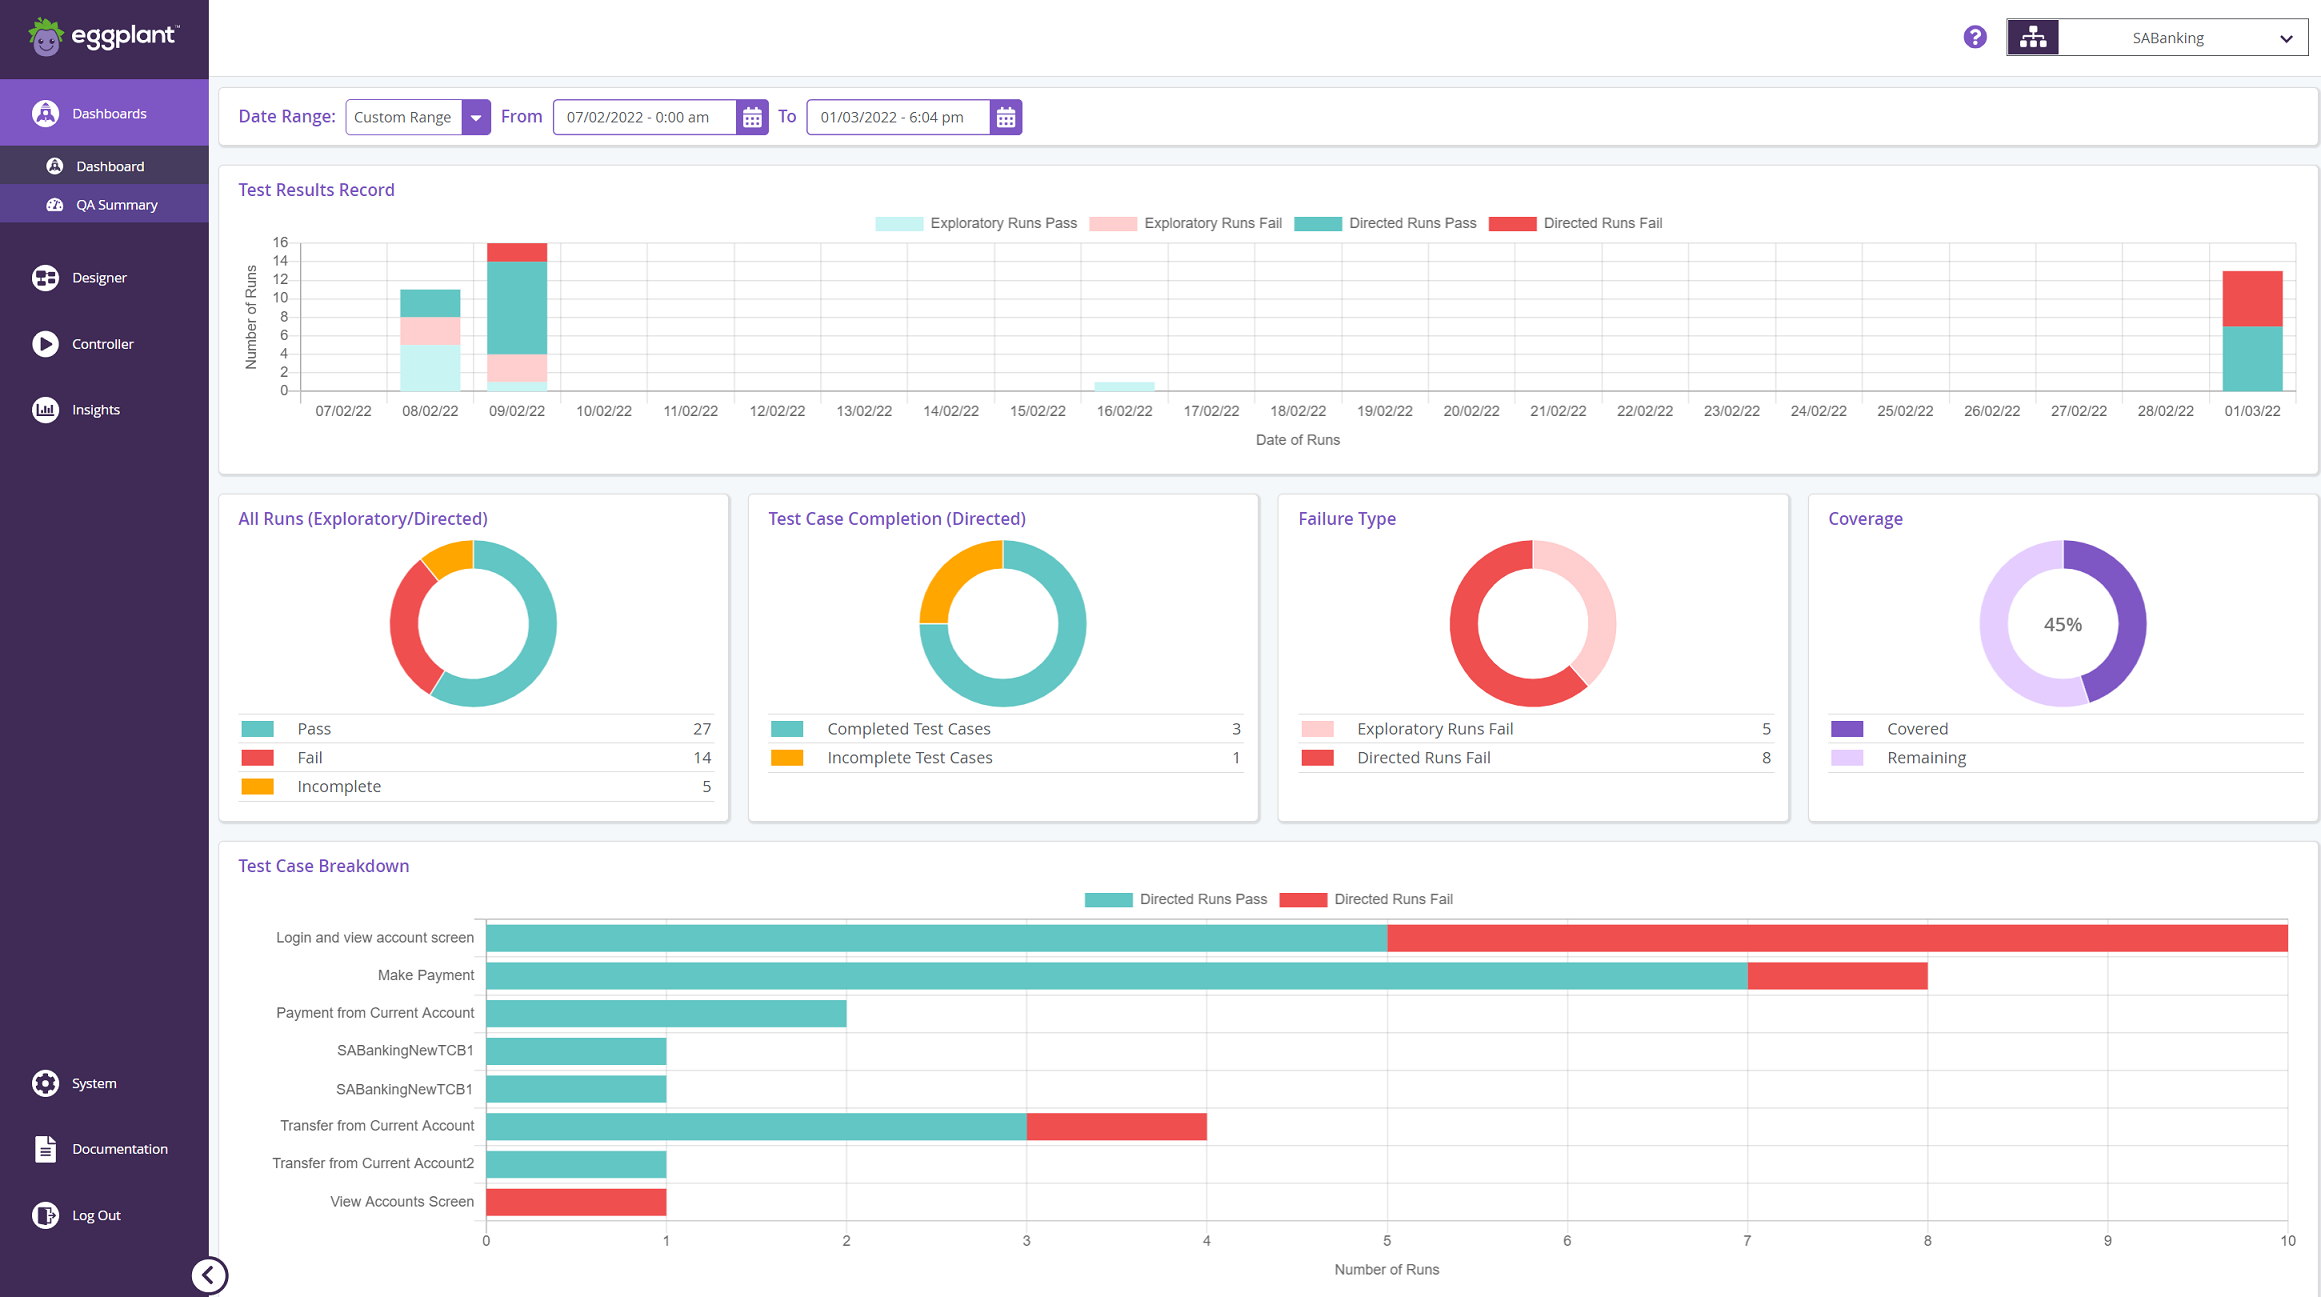
QA Summary Dashboard
Use the QA Summary dashboard to view a snapshot of your recent testing activities for directed and exploratory test cases. Directed test cases are specific user journeys in your model runs, which you define in the Test Case Builder.
The following widgets make up the QA Summary Dashboard:
- Test Results Record
- All Runs (Exploratory/Directed)
- Test Case Completion (Directed)
- Failure Type
- Coverage
- Test Breakdown
You can either:
- View the collected summary data for a standard date range: Today, Yesterday, Last 3 days, Last 7 days.
- Choose a custom range for your snapshot by selecting From and To dates. If you don't define the To date, Eggplant DAI uses the current date for that value.
If no date is specified, the dashboard displays data for the last seven days.
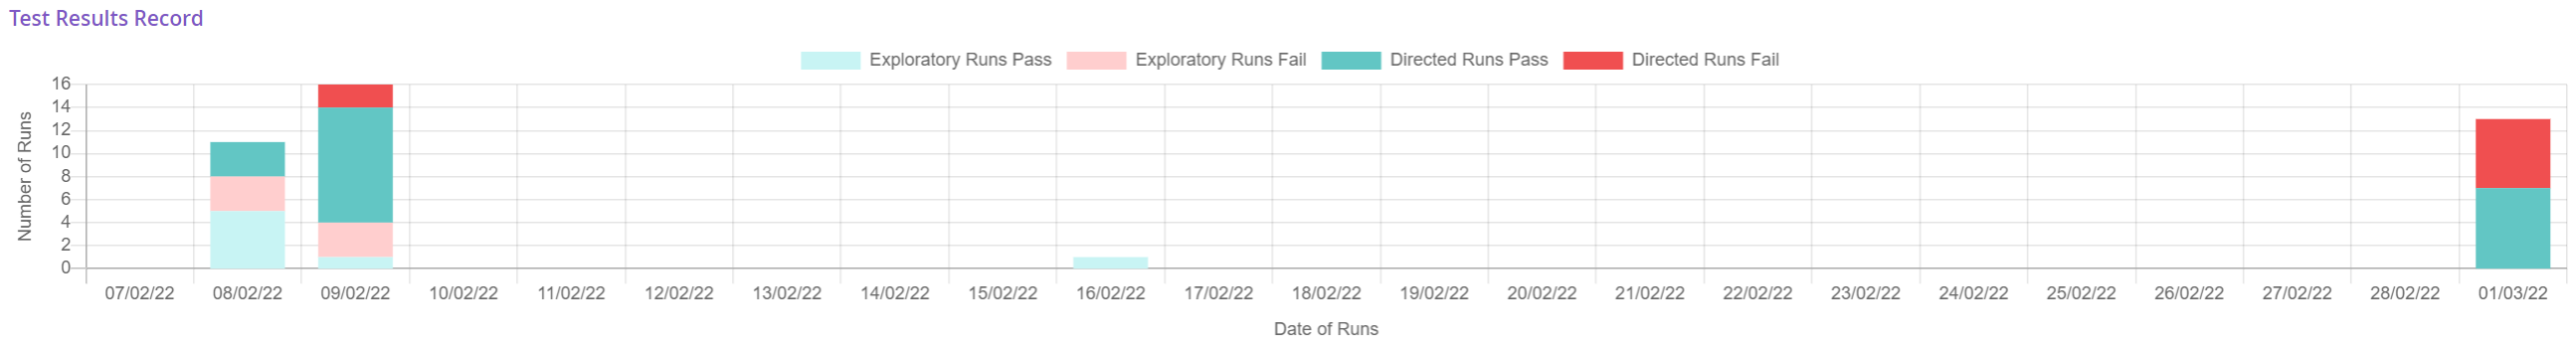
Test Results Record
The Test Results Record shows the distribution of successful and failed test runs for the selected date range. It captures information about exploratory test runs through your model as well as directed test cases. The status and type of runs are color-coded for easy reference.
All Runs (Exploratory/Directed)
The All Runs donut chart and legend represent how many of the model’s test cases have been executed for both exploratory and directed test cases.
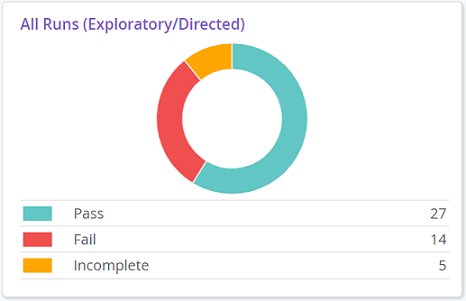
The All Runs widget provides the following information:
- Pass: The total number of passed test runs.
- Fail: The total number of failed test runs.
Incomplete: The total number of incomplete test runs which either resulted in errors or ended abruptly for various reasons.
Test Case Completion (Directed)
The Test Case Completion donut chart and legend show the proportion of directed test cases that exist for the selected model that have been run to pass or fail.
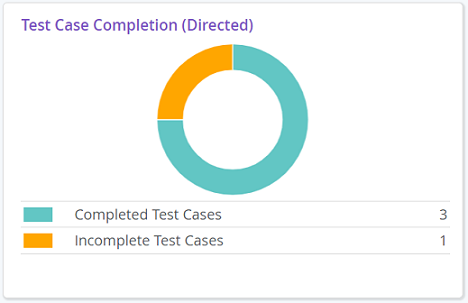
- Completed Test Cases: The total number of successful test cases. If a test case has been run 10 times, it'll still be counted as one completed test case.
- Incomplete Test Cases: The total number of directed test cases that are incomplete or have not been attempted yet.
Failure Type
The Failure Type donut chart and legend shows a breakdown of test run failures for directed and exploratory tests.
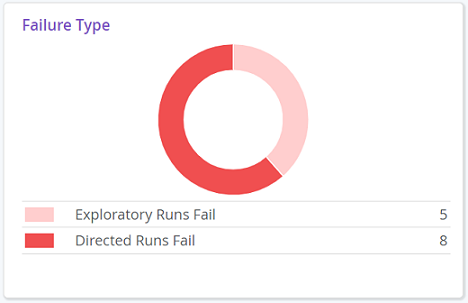
- Failed Exploratory Runs: The total number of failed test runs when running exploratory tests from both the Model workspace and Runner.
- Failed Directed Test Cases: The total number of directed test cases that failed when running tests from Designer > Test Cases.
Coverage
The Coverage donut chart and legend represent the test coverage of all the runs from the latest version of the model. Coverage represents what percentage of your model has been visited during test runs. During a test run, Eggplant DAI calculates coverage for possible paths based on various combinations of sequences of actions in the model.
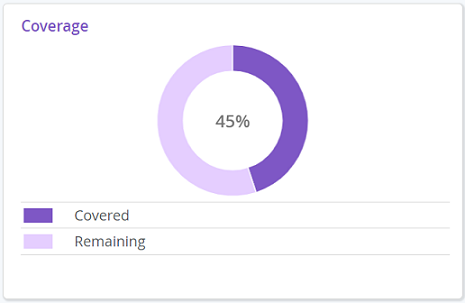
The maximum test coverage that can be achieved may be below 100%.
The Coverage chart provides the following information:
- Covered: The percentage of tests covered for all the runs in this model.
- Remaining: The percentage of tests that are yet to be covered, i.e., remaining paths of a model that have not been hit during the test run.
For more information on how to view the total coverage for your model, see Coverage.
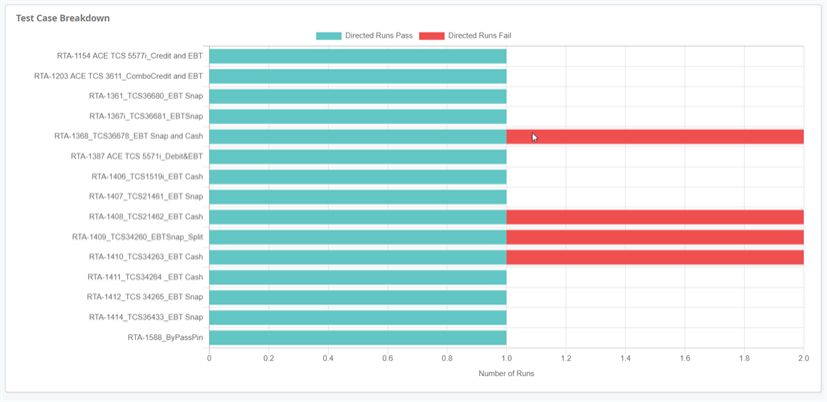
Test Breakdown
The Test Breakdown chart shows success metrics for individual test cases that have been run.